Latency and Throughput Benchmarking Inside Eval Harnesses
The harness, not the model, drives latency and throughput.
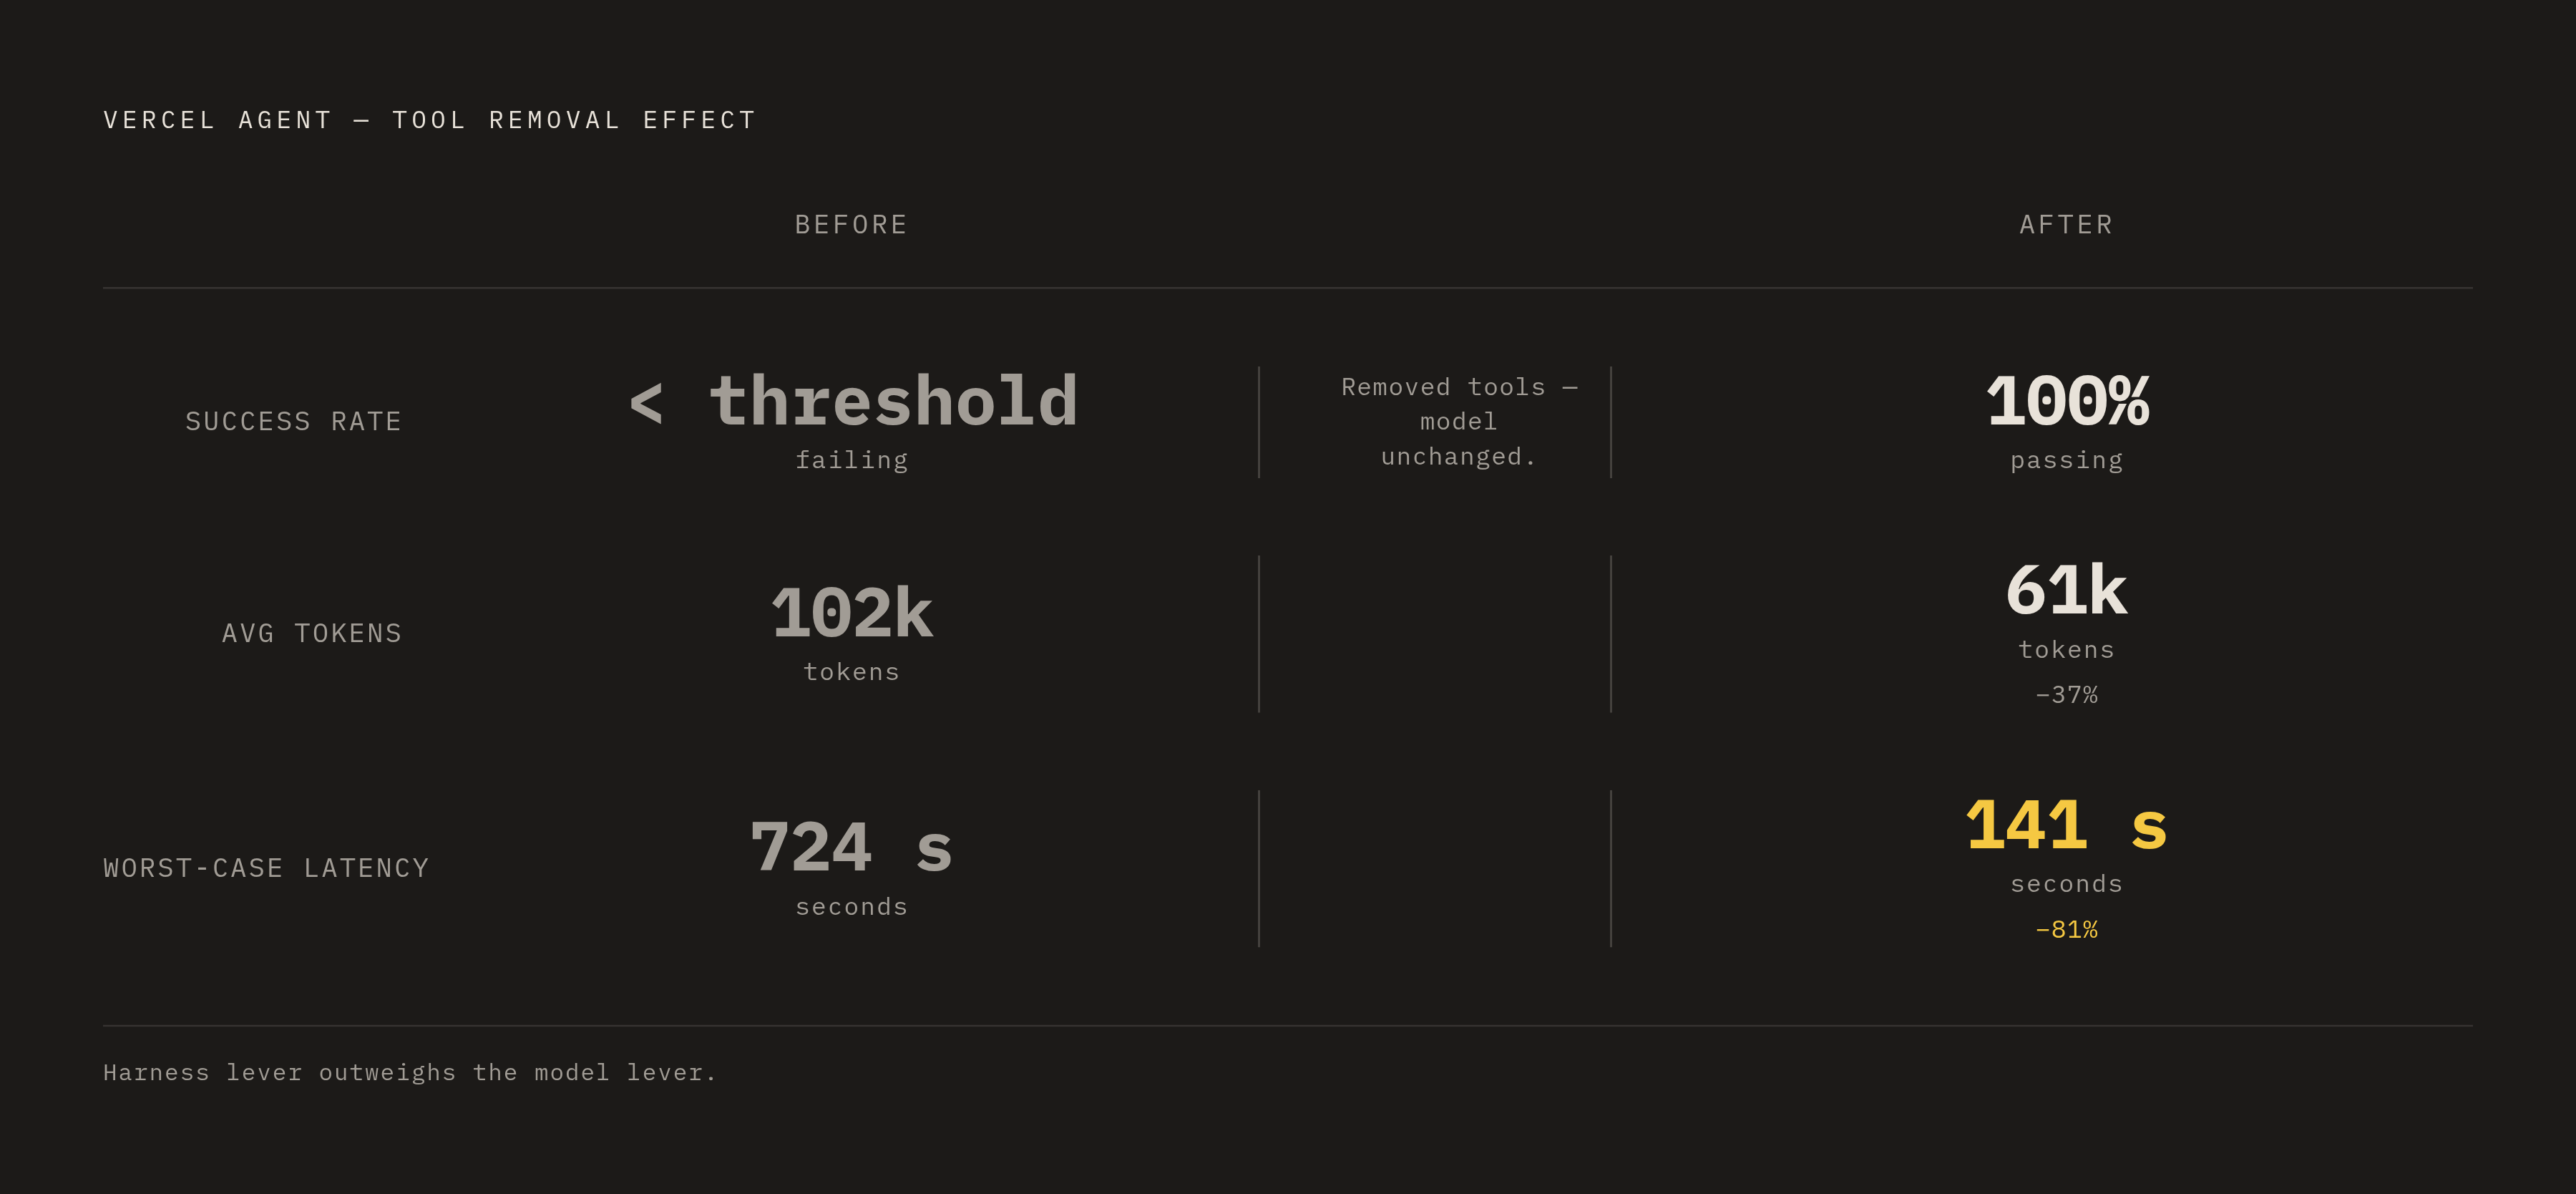
A benchmark result that doesn't document how the harness around the model was built tells you little about the model. Vercel's own engineering team found this out directly: by stripping tools out of an agent running on the same underlying model, they moved the agent's success rate from a failing threshold to a perfect score, cut average token usage by roughly 37 percent (from around 102,000 tokens to about 61,000), and brought latency down from 724 seconds in the old architecture's worst case to 141 seconds in the new one. Nothing about the model changed in that comparison. The lever that moved every number was the harness: fewer tools, less overhead, a leaner path from request to response. Any latency or throughput figure that doesn't say what the harness looked like when the number was produced is reporting a property of that harness, dressed up as a property of the model that happened to be running inside it.
What latency and throughput mean inside an eval harness
Practitioners benchmarking LLM serving track five distinct quantities, and treating them as interchangeable is the first way a number stops meaning what it claims to mean. Time to First Token, or TTFT, is the delay before any output appears at all, and it's the figure that chat interfaces and agentic workflows live or die on, since a user or a downstream tool call waits on it before anything else can happen. Time Per Output Token, or TPOT, sometimes called inter-token latency, is a separate quantity: it governs how fast the response feels once it has already started streaming, and a system can have excellent TPOT while still feeling sluggish because of a slow TTFT, or the reverse. End-to-end latency folds both together into a single wall-clock number, which is useful but hides which half of the pipeline is actually slow. Throughput, measured in tokens or requests per unit time, is a system-level quantity shaped by concurrency and batching as much as by the model doing the work. Goodput narrows throughput down further, counting only the requests that meet a stated latency service-level objective; the concept was adapted for LLM serving in the academic DistServe system, which defines per-GPU goodput as the maximum request rate a system can serve while still meeting its SLO target, and the metric is implemented directly in vLLM's benchmarking code. A throughput number reported without a goodput figure attached is compatible with almost any latency budget you'd care to imagine, since nothing in it says how many of those fast requests were actually fast enough to be useful.
Reasoning mode breaks this picture open further, because it doesn't just slow a model down incrementally, it moves the measurement into an entirely different latency category. DigitalApplied measured GPT-5.5 Pro running at high reasoning effort and found a TTFT P50 of 67 seconds, a figure that reflects extended thinking inflating TTFT somewhere between five and thirty times across frontier models generally. A harness that toggles reasoning effort on or off between runs is comparing two different kinds of system and reporting the result as if it were one number.
The four layers of a harness stack (model, harness, framework, platform) and their latency budgets
Latency inside an agentic system accumulates across four separable layers, model, harness, framework, and platform, and each one adds its own cost independent of what the model itself is capable of. Sebastian Raschka's breakdown of a single harness names six components that each eat into the latency budget before a model ever finishes generating a response: live repository context gathered before the first prompt goes out; a prompt split between a cached prefix and a variable suffix; a set of predefined tools, each carrying its own validation step and path-based access control; clipping and compression routines that keep the context window small enough to stay fast; structured session memory kept separate from the full conversation transcript; and bounded subagents, running with read-only permissions and a hard recursion limit. None of these six pieces is a property of the model. Every one of them is a decision made by whoever built the harness, and every one of them can be changed without touching the model.
Among these, tool-set size turns out to be the single most controllable latency variable available to harness builders. Tool removal, not a different model, produced the largest single latency reduction in the available evidence, taking the Vercel system from 724 seconds down to 141. Loop architecture is where the next round of gains is being found. Research into loop-level parallelism, replacing the traditional sequential observe-then-act cycle with a structure that lets multiple steps proceed at once, produced a meaningful speedup on one coding benchmark and a similarly sized speedup on a terminal-use benchmark, with zero false accepts recorded across thousands of audited commit records once validation and commit ordering were enforced by the harness. Restructure only the loop while running the same model on the same benchmark, and performance improves by more than a quarter with no change to the model. That result alone settles the question of whether the model is still the primary variable in these numbers.
The measurement harness itself, tool choice, concurrency profile, and warm-up conditions as a confound in any benchmark
A benchmark that leaves its own configuration undocumented cannot be reproduced, and a result nobody can reproduce cannot be meaningfully compared against any other published number. Reproducible measurement depends on open tools that expose their parameters. IntuitionLabs points to vLLM's own benchmarking utilities, NVIDIA's GenAI-Perf, and Anyscale's LLMPerf as the shared toolkit practitioners draw on, and all three make concurrency, timeout behavior, and the input and output token-length distributions explicit settings. That transparency is the standard the rest of the field should be held to: a number is only as trustworthy as the configuration that produced it is legible to someone else trying to reproduce it.
Vendor-reported figures deserve a different kind of scrutiny than independently measured ones, because the two are produced under different incentives. IntuitionLabs cites NVIDIA's claimed combined tokens-per-second figure across eight Blackwell B200 GPUs and AMD partner Mangoboost's claimed tokens-per-second figure on a four-node MI300X cluster as cases where that distinction matters, and recommends checking such claims against third-party trackers such as Artificial Analysis. The three most commonly undisclosed variables in published benchmarks are warm-up state, concurrency profile, and timeout handling. A cold-start measurement and a warmed-cache measurement taken from the identical model can differ by orders of magnitude, and a benchmark that doesn't say which condition it measured hasn't actually reported either one reliably. Anyone reading a latency number without that context is reading a number whose meaning is still undetermined.
Hardware architecture, not model size, sets the throughput ceiling
Throughput is bounded by the hardware a model runs on at least as much as by the model's own size, and any benchmark that varies the model while holding the provider fixed is quietly measuring the provider. Groq's LPU architecture is built to minimize memory access overhead on a per-token basis, and Cerebras runs on wafer-scale silicon; both serve the same open-weight model weights that GPU-based providers serve, and both do it faster, because the bottleneck each architecture runs into is different from the one a GPU runs into. Selecting a provider for an eval harness is therefore a decision with as much weight on the final latency and throughput numbers as selecting the model itself, and a benchmark that fixes the model while only varying prompt content is measuring that one provider's behavior on that model, not the model's behavior in any general sense.
Geography adds a further variable that's easy to miss. DigitalApplied measured a TTFT difference of 180 to 220 milliseconds between US-East and APAC regions, consistent across all the major providers tested. A harness run from a single region produces numbers that don't carry over to a deployment running somewhere else. Optimization techniques compound this problem further, since each one targets a specific bottleneck. Continuous batching, measured at a dramatic throughput improvement in an academic serving system, trades off differently than another technique for managing the KV-cache, which trades off differently again than speculative decoding, quantization, or disaggregated prefill-and-decode serving. A harness that doesn't control for which of these techniques is active is measuring one particular configuration of a serving stack, and reporting the result under the model's name.
How eval harnesses split quality from timing
A distributed trace showing a fast LLM call returning a success status code says nothing about whether the response was actually grounded in the right sources, whether the agent picked tools in a sensible order, or whether a correct answer this time arrived through a path that will break the next time a slightly different input comes through. Speed and a green checkmark are compatible with a system that's quietly wrong. A systematic study of seven frontier models across 36 long-horizon research and development tasks found that observed performance is shaped by multiple factors, including distinct process bottlenecks that sit behind outwardly similar final outcomes. Two runs can land on the same final score for entirely different reasons, one through a solid process and one through a fragile one, and a timing metric alone has no way to tell them apart.
Well-built eval harnesses respond to this by formally separating quality measurement from timing measurement. A readiness harness for LLM and retrieval-augmented applications, for instance, combines automated benchmarks, OpenTelemetry observability, and CI-level quality gates under a single minimal API contract, and aggregates workflow success, policy compliance, groundedness, retrieval hit rate, cost, and P95 latency into scenario-weighted readiness scores plotted along Pareto frontiers. That Pareto framing is the part of the architecture that does the real work: cost and latency trade off directly against quality inside these harnesses, so a benchmark reporting only one axis isn't giving you a deployment decision, it's giving you one coordinate of a decision that needs several. The eval pipeline that produces these scores carries its own latency budget too, with unbounded trace streams, ensembles of frontier models acting as judges, and hard operational problems around queue mechanics, worker reliability, and idempotency under retry. That pipeline is itself a system, and it requires the same instrumentation discipline as the harness it's evaluating, not an exemption from it.
A practical checklist for isolating harness-side variables before treating any latency or throughput number as a model property
Rigorous benchmarking depends on documenting and controlling every harness-side variable before a single number gets attributed to the model, and that discipline starts with recognizing that reasoning mode is a different category of system: for any workflow with a latency budget under two seconds, extended thinking disqualifies a model. The tool set deserves the same explicit treatment, with the number of tools, their validation overhead, and their access-control path all stated, since the Vercel result shows tool-set size is the single highest-leverage variable available for cutting latency. Provider configuration needs the same full accounting: model ID, API tier, region, concurrency level, retry policy, and hardware class, because throughput figures don't transfer across providers running identical weights on different silicon. Reported latency should be the P95 figure rather than the P50, since P50 functions as the marketing number while P95 reflects what production actually delivers, and providers tend to differ from each other more sharply at P95 than at P50. Timestamped request metadata and the code used to calculate percentiles should be kept on hand so that anyone reviewing the result can recompute those percentiles independently. Quality metrics belong alongside timing metrics rather than standing in for them: groundedness, retrieval hit rate, workflow success rate, and policy compliance can't be derived from a latency trace and need their own measurement path running in parallel. Loop architecture is worth a direct audit too, since sequential observe-then-act loops leave real speed on the table, and loop-level parallelism with harness-enforced validation has now been shown to deliver meaningful gains without introducing false accepts. The eval pipeline itself needs instrumentation as well, because queue mechanics, worker reliability, and retry idempotency are latency sources that live inside the measurement infrastructure, not inside the model, and a pipeline that isn't observed produces numbers whose origin nobody can actually trace.
That same discipline extends past the harness to the data an agent operates on once it's deployed. Proactive, continuously instrumented monitoring, rather than alerts that fire only after something has already broken, applies just as much to the systems of record an agent reads from as it does to the harness measuring its speed. An agentic harness running against stale or inconsistent CRM data is measuring a data problem and reporting it as if it were a model problem, and the fix for that belongs at the data layer, not inside the harness built to time the model.